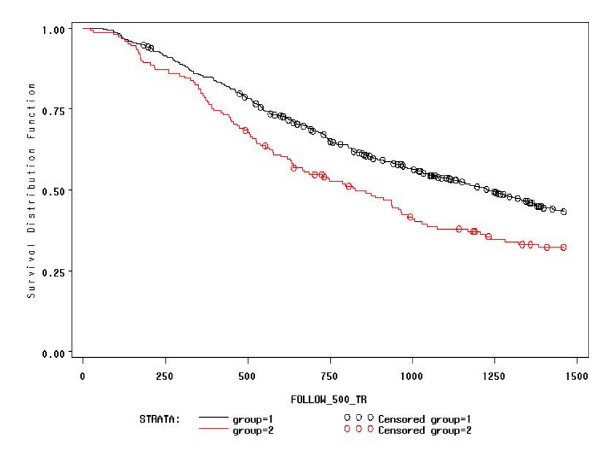
Figure 1.
Proportion of patients not having CD4+ ≥ 500/mm3 at each time point (the NNRTI group is represented with the black line and the NRTI group is represented with the red line). Legend to figure 1: Time (days) is represented on the x-axis, truncated at 1,460 days when 20% of the study patients were still observed.

