Fig. 1.
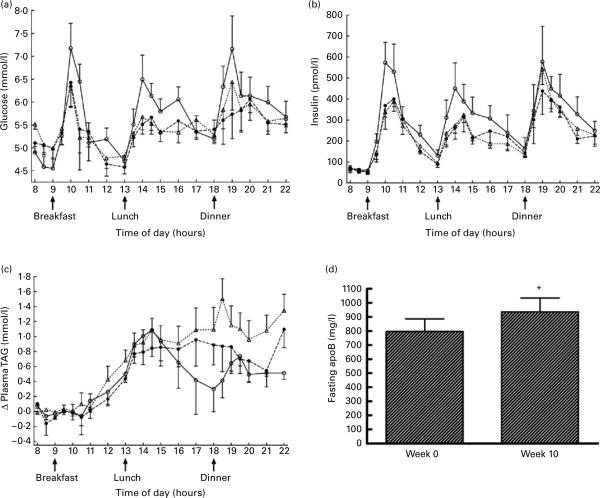
Changes of plasma glucose (a), insulin (b) and TAG (c) over the three 14 h sampling periods during which subjects consumed either a high-complex carbohydrate diet (0 weeks; –◯–) or an isoenergetic diet with fructose-sweetened beverages at 25% of daily energy requirements (2 weeks (- -●- -) and 10 weeks (- -△- -)). Fasting apoB concentrations at 0 and 10 weeks of fructose beverage consumption are shown in (d). Values are means, with standard errors represented by vertical bars. * Mean value was significantly different from that at week 0 (P<0.05).

