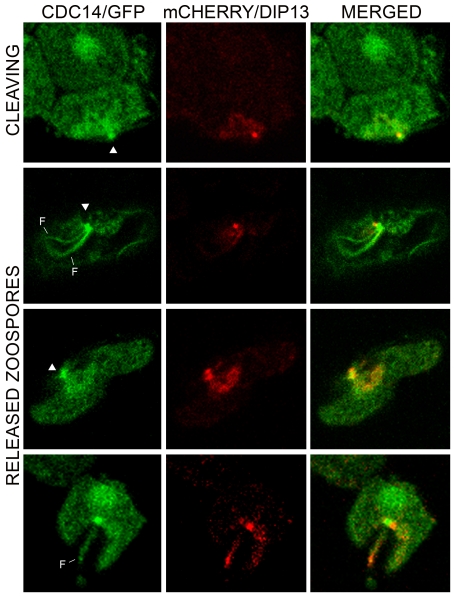
Figure 3. Colocalization of PiCdc14 and DIP13.
Shown are the locations of the two proteins in transformants expressing Cdc14 and DIP3 fused to GFP or mCherry, respectively, in a cleaving sporangium (top row) and zoospores (bottom rows). Indicated are the basal bodies (arrowheads) and flagella (F). Bars represent 4 µm.

