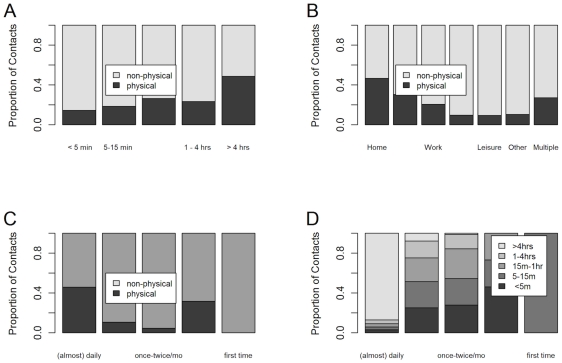
Figure 3. The location, duration and frequency of contacts.
The proportion of contacts that were physical or non-physical by duration (panel A), location (panel B) and frequency of contact (panel C). The duration of contact by frequency of contact (panel D). The figures are based on a WGEE with weights based on household size and days of the week.

