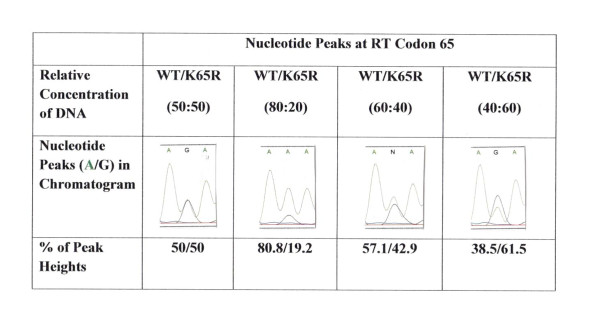
Figure 3.
Correlation between cDNA concentrations and peak heights at codon 65 in chromatogram. Different ratios of cDNA were mixed and sequencing was performed. Peak heights of wild type 'A' nucleotide and mutated 'G' nucleotide were measured and percentage of both nucleotides was calculated. A strong correlation between cDNA concentration and observed peak heights was obtained in our assay system. The difference between actual peak heights and expected peak heights in relation to DNA concentration was within a range of 2% ( ± 1-2%).

