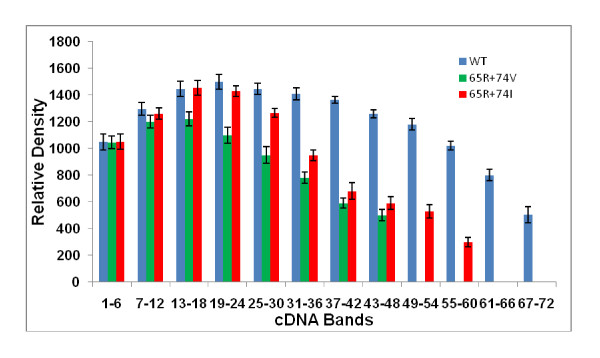
Figure 6.
Quantification of cDNA bands synthesized by WT, K65R+L74V and K65R+L74I RTs. Groups of 6 bands from bottom to top of each lane were scanned and quantified by Intelligent Quantifier software (Bio Image Systems, Inc., Jackson, MI). The graph shows the cDNA density of bands obtained with 6 μl of RT lysates. RT containing K65R+L74I mutation showed a significant increase in the density of cDNA bands (13-36) in comparison to K65R+L74V RT.

