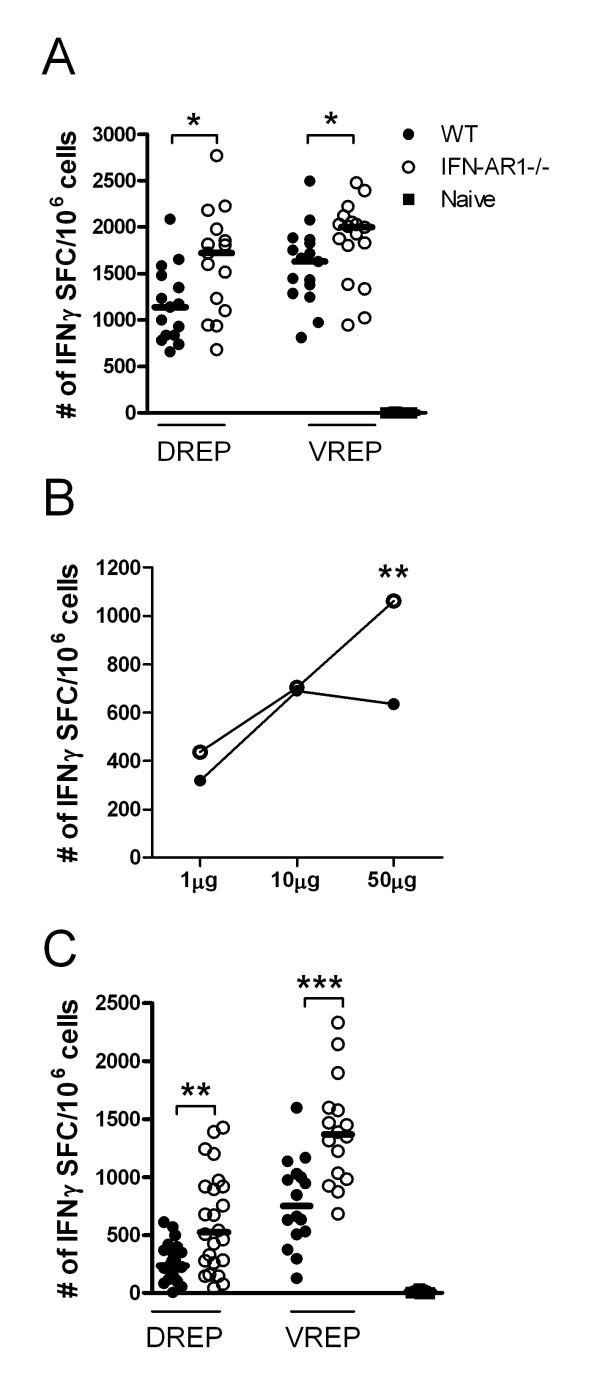
Figure 4.
OVA-specific CD8+ T cells in spleen after replicon immunization at primary peak and memory responses in wild type and IFN-AR1 KO mice. The CD8+ T cell response was measured 10 days (A) and (B) and five weeks post-immunization (C), in wild type (black circles (●)), IFN-AR1 KO (open circles (○)) and naïve (black squares (■)) mice. The numbers of OVA-specific CD8+ T cells were measured by IFNγ ELISpot (A-C). In (A) and (C) mice were immunized with 50 μg DREP-OVA and in (B) with 1, 10 or 50 μg DREP-OVA. Each symbol represents an individual mouse and the group median values are indicated by bars in (A) and (C). In (B) the group median values are indicated by circles. Values are expressed as numbers of IFNγ SFC per million splenocytes. Data are pooled from four experiments, with 5 to 10 mice per group (A) and two experiments with 10 mice per group (B), and three experiments with 5 to 10 mice per group (C). The statistical difference between the groups were p < 0.05 (*), p < 0.01 (**) and p < 0.001 (***).

