
Figure 5.
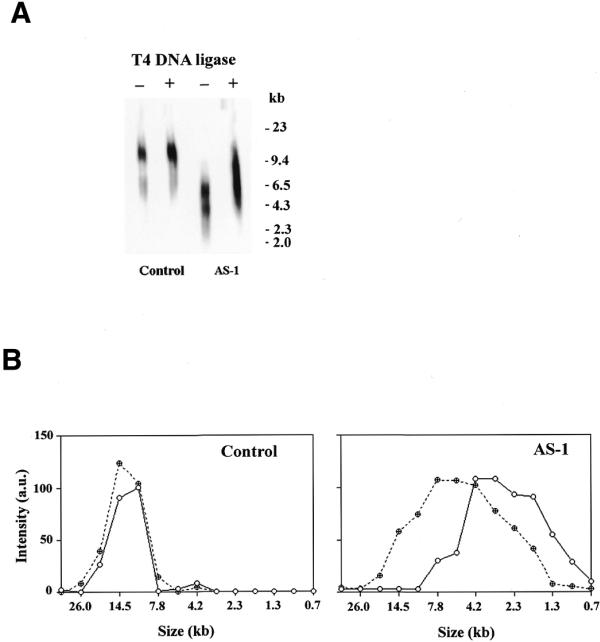
T4 DNA ligase treatment of mtDNA from control and AS1 cells. (A) Genomic DNA control and AS1 cells electrophoresed under denaturing conditions and hybridized with a mtDNA probe. –, no pretreatment; +, purified DNA treated with T4 DNA ligase prior to denaturation and electrophoresis. (B) Scanning densitometry was performed on the data presented above. (Left) DNA from control cell line; (right) DNA from AS1 cell line. Filled circles, pre-treatment with T4 DNA ligase; open circles, no pre-treatment with T4 DNA ligase. The sizes of the fragments were calculated based on the mobility of the band compared to a molecular weight standard.