Fig. 3.
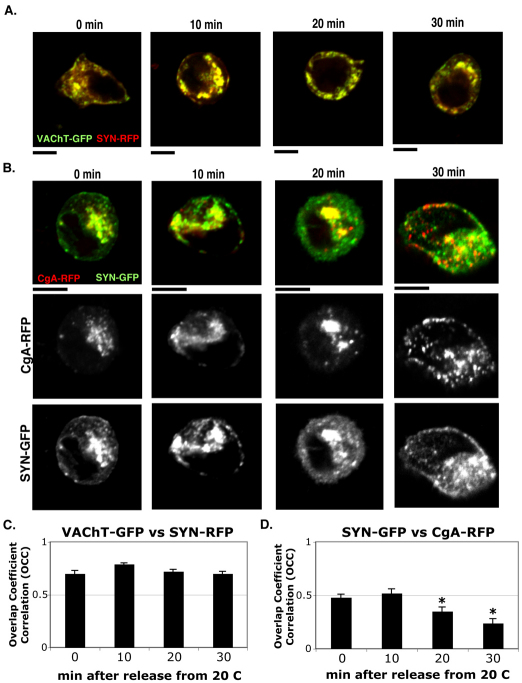
Syn–RFP co-migrates with VAChT–GFP and is passed through the CgA–RFP-containing compartment. (A) VAChT–GFP (green) and Syn–RFP (red) co-transfected into PC12 cells were tracked together through 20°C block and release. (B) Syn–GFP (green) and CgA–RFP (red) in PC12 cells were tracked together during 20°C block and release. (C) The OCCs between VAChT–GFP and SYN–RFP were measured at 0, 10, 20 and 30 minutes after release from 20°C block. (D) The OCCs between Syn–GFP and CgA–RFP throughout the temperature block and release were measured. The average OCC ± s.e.m. was calculated from three different experiments (n=30; *P<0.05, compared with the OCC at 10 minutes). Scale bars: 5 μm.

