
Figure 1. Placement of imaging slice and imaging coregistration.
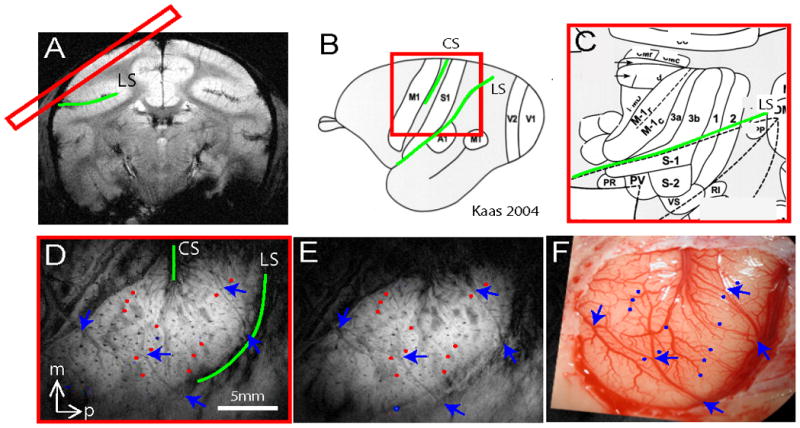
(A) One oblique image slice (red rectangle) was positioned to cover SI and M1 contralateral to stimulated fingers. (D) T2* weighted oblique structural image revealed central (CS) and lateral (LS) sulci (green lines) as well as other blood vessel features as indicated by blue arrows and red dots. (E) T2 weighted oblique structural image taken on different day revealing very similar blood vessel landmarks (arrows and dots). (F) Blood vessel map of the same region showing corresponding landmarks in D and E. Landmarks highlighted in D, E and F were used to coregister activations across image session and modality. (B & C) Brain schematic maps adapted from Kaas 2004 [22] illustrate the anterior to posterior organization of M1 to SI cortices in monkeys. (C) Zoomed-in view shows the detailed topographic organization of areas M1, 3a, 3b, 1 and 2 and their relative territory ratio. Note: the topographic organization and the territory span were determined electrophysiologically and anatomically.