
Figure 3. Single digit tactile activations in two representative monkeys (M3 and M4).
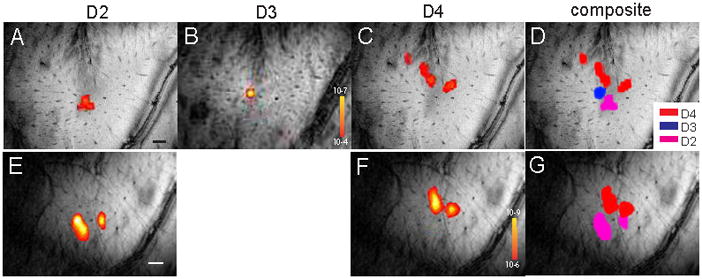
(A–C, E–F): Single condition tactile activation maps to individual digit stimulation (D2, D3 or D4). (D & G): Composite activation maps of D2–D4 (pink, blue, and red patches) in M3, and of D2 (pink) and D4 (red) in M4. Black and white bars in A and E indicate 1 mm spatial scale bar.