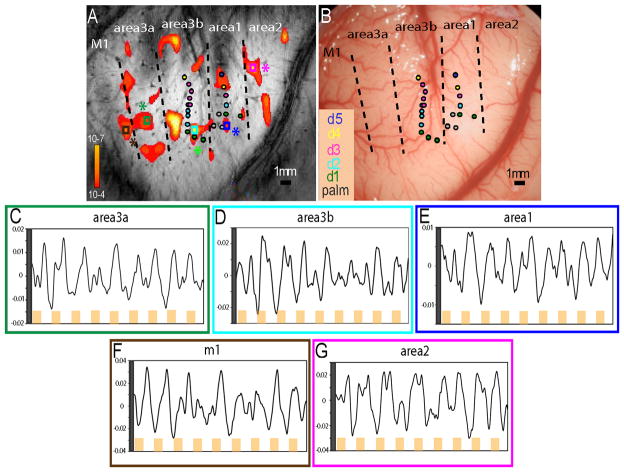
Figure 6. Single trial BOLD signal timecourse during noxious heat stimulation of the fingers.
Statistical activation map to 47.5 °C stimulation was thresholded at p≤10−4 for displaying spatially distinct multiple activation foci (A). Color scale bar indicates the p value ranges. Single trial timecourses were plotted from six selected regions of interest (indicated by small color coded boxes and stars). (C–G). Yellow bars along the X-axis indicate the repeated 24 sec heat stimulation while the white space between bars indicate the 30 sec inter-stimulus interval without stimulus. Y-axis is the percentage BOLD signal change. Electrophysiological map was aligned to structural MRI image for the determination of cortical area, and the estimated inter-areal borders (dotted black lines in B). Neuronal receptive field properties at each penetration site were color coded as D1-green; D2-light blue; D3-red; D4-yellow; and D5-dark blue. Scale bar: 1mm.

