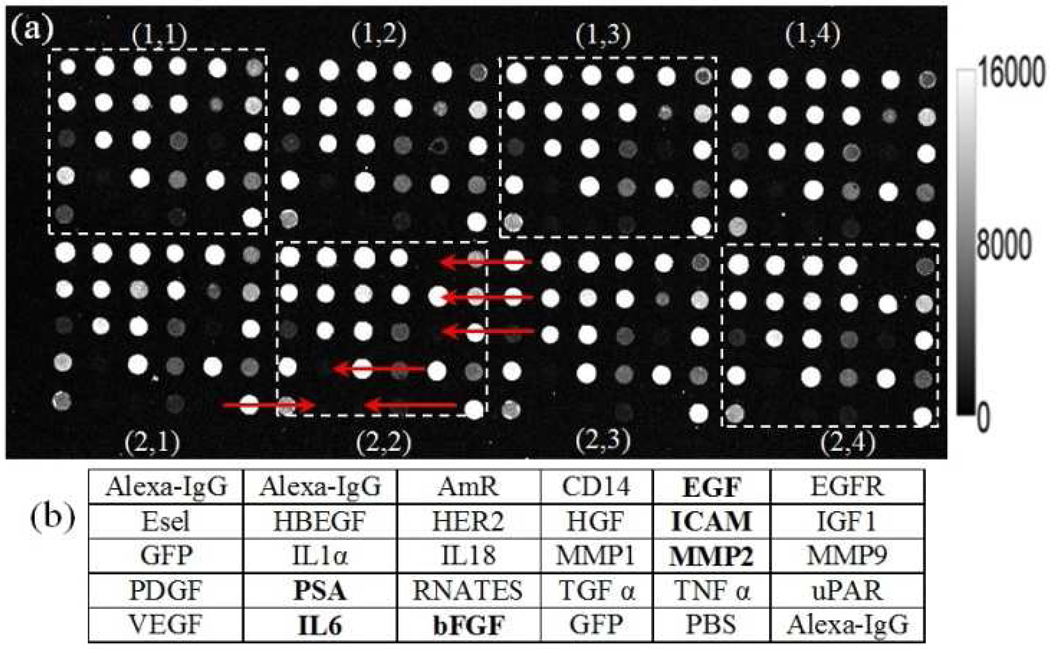
Figure 2.
(a) A fluorescent image of the highest antigen concentration is used to identify missing spots or nonfunctional assays. An array is comprised of eight replicate blocks. The scale bar is shown in the left with the unit in fluorescent signal. (b) Layout of the capture antibodies within one block. See Table S-1 for a list of assay abbreviations. Problematic assays are indicate by red arrows in Panel A, and by bold font in Panel B.

