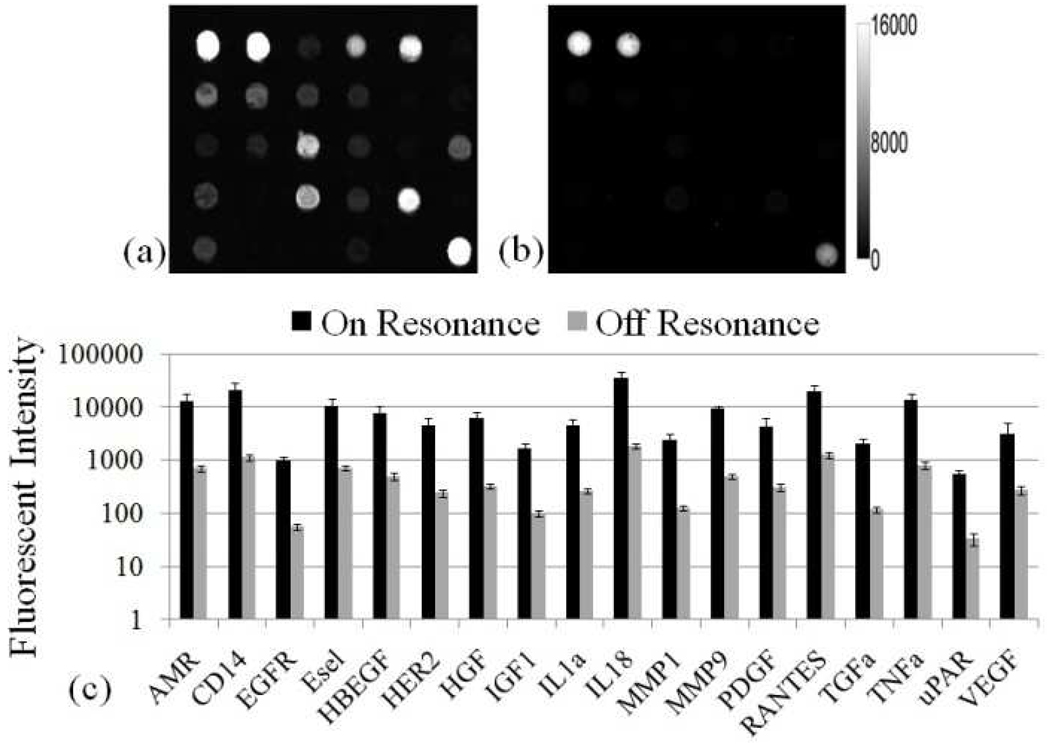
Figure 3.
Fluorescence images of (a) PC on-resonance and (b) PC off-resonance for one block of the array exposed to the second highest analyte concentration. Both have the same fluorescent intensity scale shown in the left of (b). (c) Comparison of on-resonance and off-resonance measurements for each functional assay in the array for the second highest analyte concentration Error bars represent the standard deviation of eight replicate spots, taken across eight blocks in the array.

