
Figure 4.
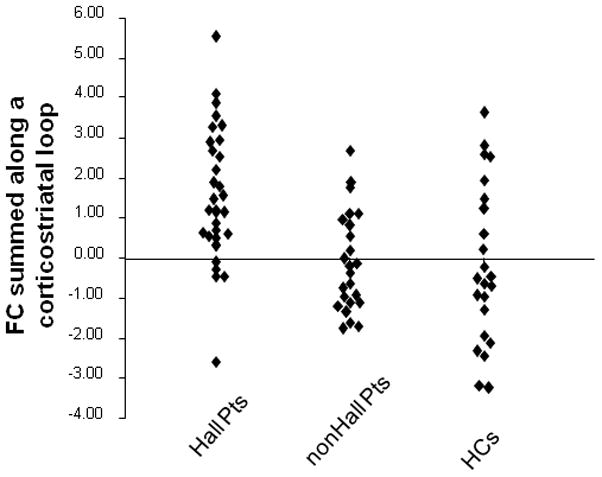
Scatterplots of FC summed along the corticostriatal loop defined according to Figure S1 section (see Supplement) comparing hallucinating patients, nonhallucinating patients and healthy controls. Y-axis reflects summed FC scaled as z-scores. An analysis of variance followed by Duncan pairwise comparisons with cut-off of p=0.05 demonstrated that hallucinators had significantly greater corticostriatal FC compared to both nonhallucinating patients and healthy controls.