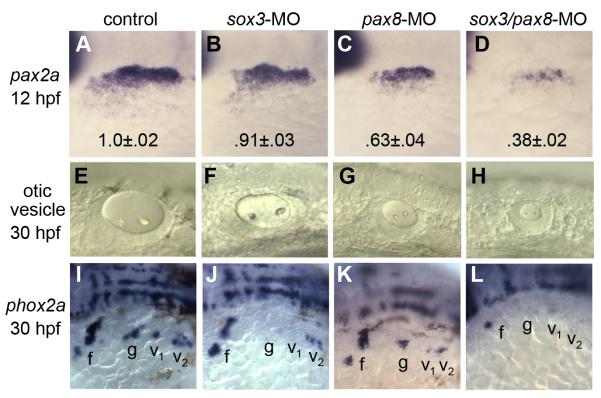
Figure 2. pax8 and sox3 interact in otic and epibranchial induction.
(A-D) pax2a expression in the otic/epibranchial domain at 12 hpf in a control embryo (A), sox3 morphant (B), pax8 morphant (C) and sox3-pax8 double morphant (D). Numbers indicate normalized values for the mean ± standard deviation of the area of the pax2a expression domain (n=10 specimens for each background). Area was calculated by outlining otic-epibranchial domains in Photoshop and measuring the number of pixels within. Differences between the morphants and the control were highly significant (p<.0005) as determined by t-tests. (E-H) otic vesicles at 30 hpf in a live control embryo (E), sox3 morphant (F), pax8 morphant (G) and sox3-pax8 double morphant (H). (I-L) expression of phox2a at 30 hpf in a control embryo (I), sox3 morphant (J), pax8 morphant (K) and sox3-pax8 double morphant (L). Positions of the facial ganglion (f) glossopharyngeal ganglion (g), and vagal ganglia (v1 and v2) are indicated. All images show lateral views with anterior to the left.

