
Figure 2.
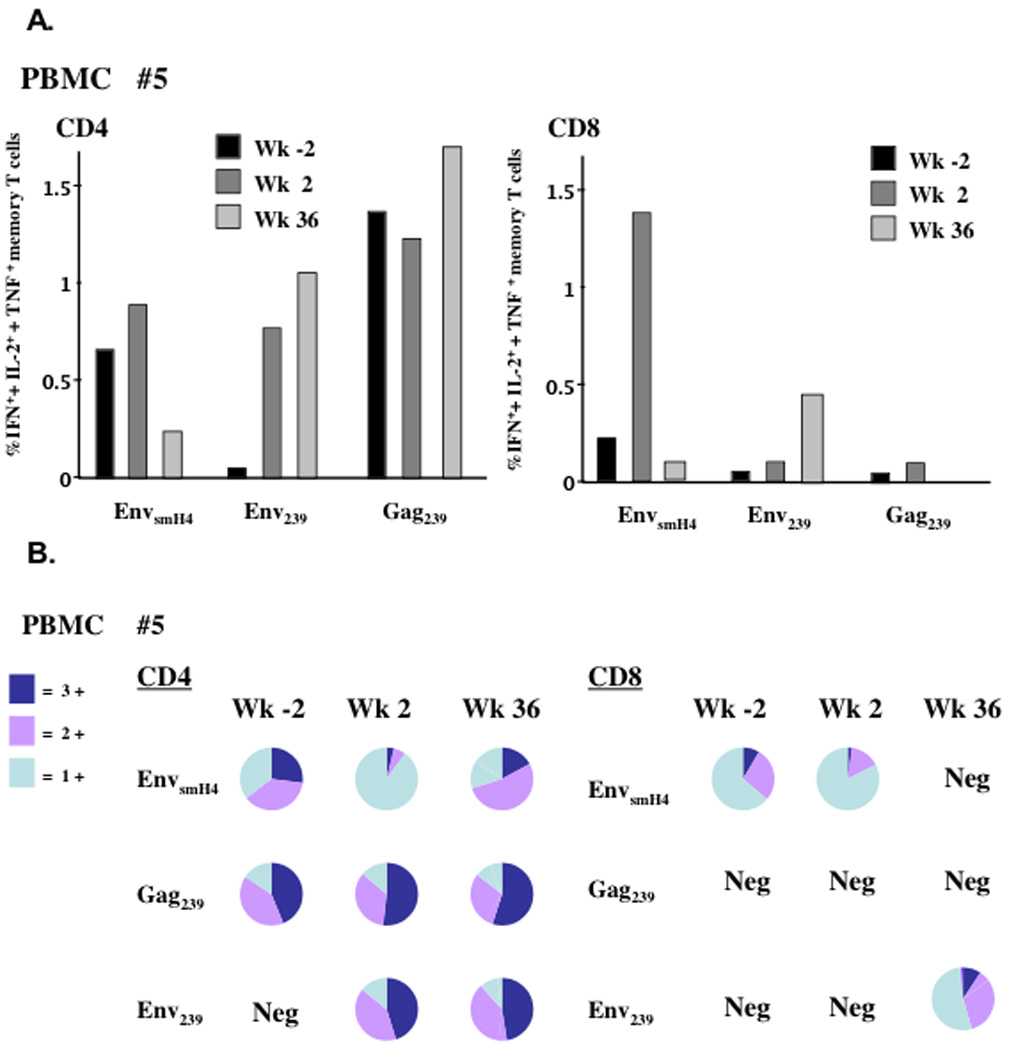
The sum percent of IFN-γ+, + IL-2+, + TNF-α+ total memory T cells in PBMCs for macaque #5. (A) Shown are the total cytokine positive cells among total memory CD4 or CD8 T cells at weeks −2, 2 and 36 post SIVsmE660 challenge after stimulation with three separate peptide pools. (B) Pie charts for each flow sample from panel A, representing the percent triple, double and single cytokine secreting cells. Neg = negative response.