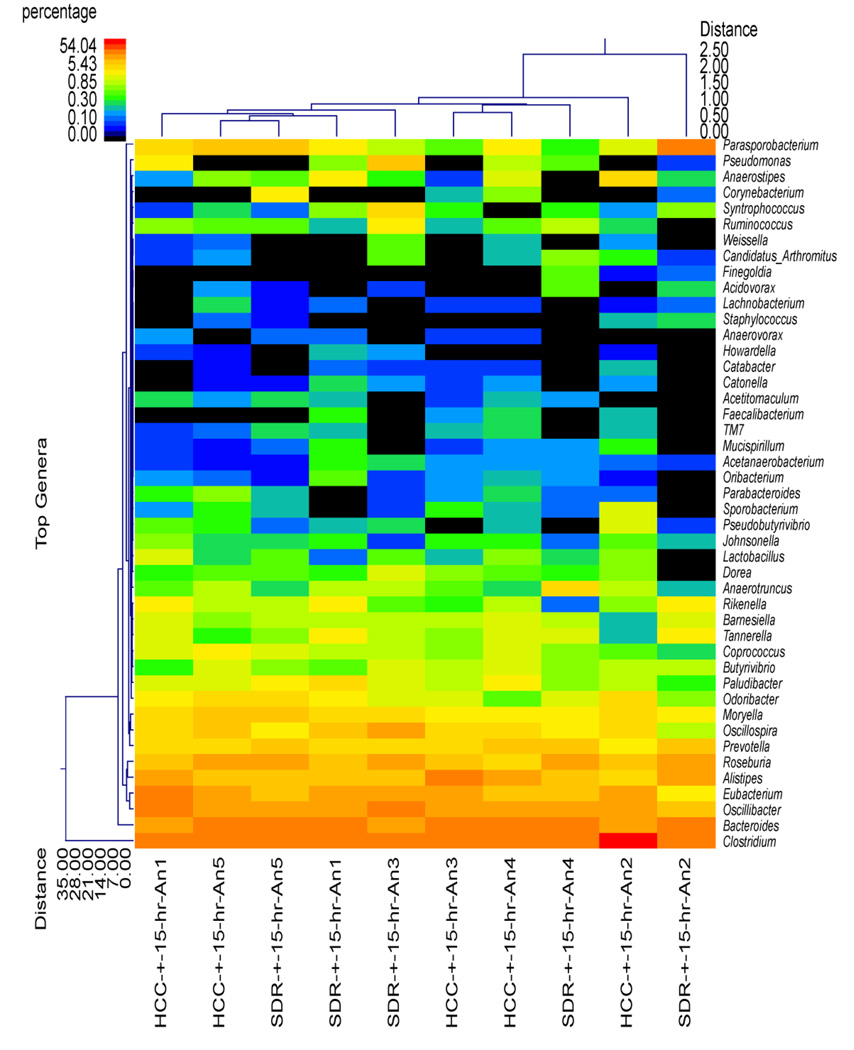
Figure 3.
Cecal microbiota community structure in the SDR + 15 hr and HCC + 15 hr mice. The dual hierarchal dendrogram describes the top 40 bacterial genera detected in the SDR + 15 hr and HCC + 15 hr samples. The heat map indicates the relative abundance of the given genus within each sample ID with a color legend and scale provided. The distance of the samples based upon weighted pair linkage and Manhattan distance methods with no scaling is provided at the top of the figure along with a distance score. The bacterial genus and the associated clustering are provided along the y axis, and their associated distance scores are indicated. The dual hierarchical clustering indicates that 3 of the 5 SDR + 15 hr samples clustered together with, and thus are similar to, 2 of the 5 HCC + 15 hr samples. One SDR + 15 hr sample clustered with the remaining 3 HCC + 15 hr samples, and one SDR + 15 hr sample was found to be unique from the other HCC + 15 hr and SDR + 15 hr samples. n = 5 per group

