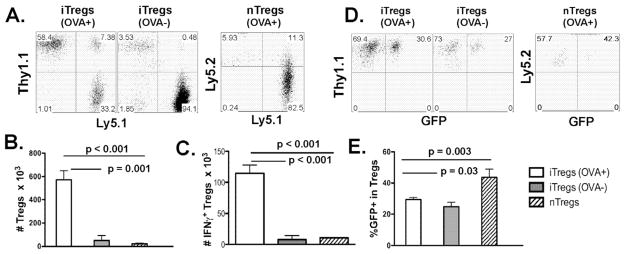
Fig. 6. Expansion and stability of Tregs in the recipients after allogeneic BMT.
Experimental setting is the same as described in figure 5. One additional group of recipients was transferred with 0.5 × 10⁶/mouse nTregs isolated from naïve B6 foxp3/gfp KI mice (Ly5.2+Ly5.1−). A, percentages of Thy1.1+Ly5.1− (iTregs) or Ly5.2+Ly5.1− cells (nTregs) on gated CD4+ live cells in recipient spleen. B, absolute numbers of iTregs or nTregs are shown. C, absolute numbers of IFNγ+ iTregs or nTregs are presented per spleen. D, GFP expression on gated iTregs or nTregs in recipient spleen. E, percentages of GFP+ cells among gated iTregs or nTregs are shown in average ± 1 SD. Each group includes 3 or 4 mice, and the data represent 1 of 3 replicate experiments.

