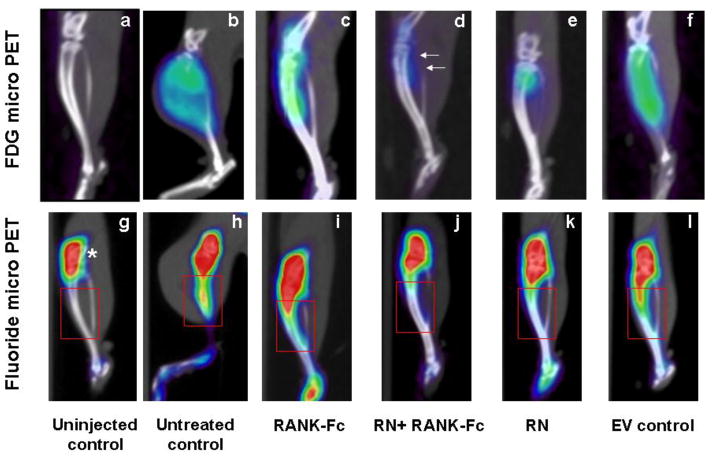
Fig. 3.
18F- fluorodeoxyglucose (top panel) and 18F-fluoride (bottom panel) micro PET-CT Top Panel (a–f): 18F- fluorodeoxyglucose (FDG) which correlates with cellular glucose metabolism demonstrated increased uptake by the tumor tissue in study groups at 12 weeks. The FDG uptake was lowest in animals treated with RN+RANK-Fc (white arrows in d) compared to the other treatment group animals. There were large variations in the FDG uptake in C4 2b tumors in all the groups. Bottom panel (g–i): 18 F-fluoride which correlates with the bone turnover shows increased uptake in all the injected tibias. Uptake of fluoride tracer by the growth plate (uninjected control tibia; asterisk in g) limits correct estimation of uptake of fluoride tracer in the proximal tibia in this animal model. However, increased uptake of fluoride tracer was seen in untreated control, EV control and RANK-Fc tibias extending up to the middle third of the tibias (red boxes in h, i and l) compared to the RN and RN+RANK-Fc tibias (red boxes in j and k) where it was limited to the upper tibia.

