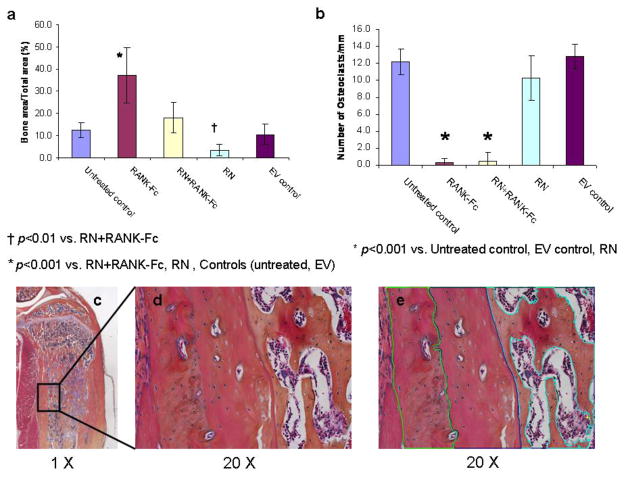
Fig. 7. Histomorphometry.
The tumor induced new bone formed in the injected tibias was quantified using bone area/total area (BA/TA) inside the medullary cavity (a). The BA/TA in the RANK-Fc tibias (37.2±12.5) was significantly higher (p<0.001) than the RN+RANK-Fc(18±7), RN (3.3±2.7), untreated control (11.8±4) and EV control (9.3±4.6) tibias. The BA/TA was significantly lower in RN tibias (p<0.01) when compared to the RN+RANK-Fc tibias. B. The number of osteoclasts per mm of bone perimeter at the tumor-host bone interface was quantified to study the effect of RANK-Fc on osteoclasts. The number of osteoclasts/mm were significantly lower (p<0.001) in the tibias treated with RANK-Fc (RANK-Fc group and RN+RANK-Fc group) compared to tibias not treated with RANK-Fc (untreated control, EV control and RN group). Image c (1 x image), image d (20 X image) and image e (green highlighting extracortical new bone; blue highlighting host original cortex; turquoise highlighting intramedullary new bone formation) demonstrating the regions used for BA evaluation during histomorphometric analysis. Tumor associated intramedullary new bone (outlined in turquoise color in image e) was measured at 20X magnification on orange G stained histologic slides to measure BA.

