
Fig. 3.
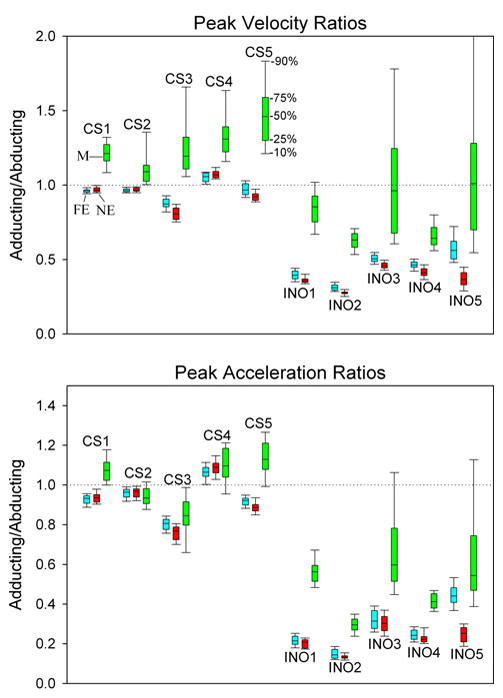
Box plot summary of ratios of peak velocity (top) and peak acceleration (bottom) of adducting/abducting components of each saccade; percentiles are indicated (50% corresponds to the median value). For each subject, the ratio is presented in the order of far equidistant targets (FE, blue), near equidistant targets (NE, red) or during the Müller paradigm (M, green). For each control subject (CS), FE and NE are similar, but M is generally greater. All INO patients show much smaller ratios that control subjects, reflecting their slowed adduction due to MLF demyelination. INO patients also show a large increase of adducting/abducting ratios during the Müller paradigm