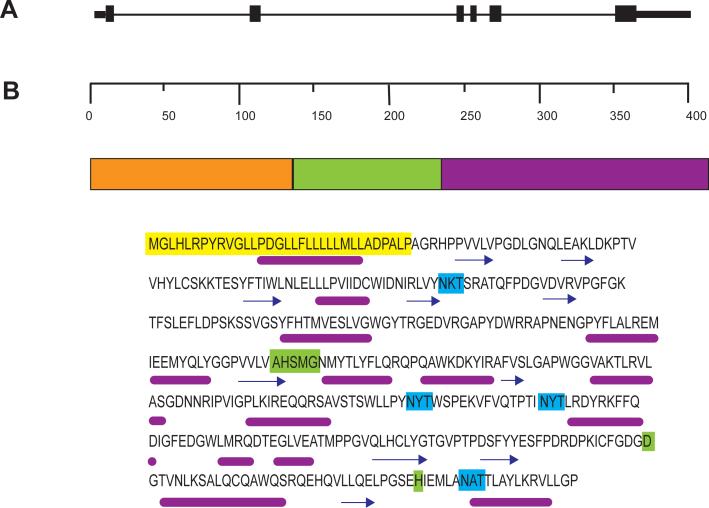
Fig. 3.
A. Genomic structure of LPLA2. The gene consists of 6 exons localized to chromosome 16q22.1. B. The protein structure and amino acid sequence of LPLA2. The deduced domains were derived from the Ginzu program starting with PSI-Blast. Domain 2 (residues 133 – 234) is highly homologous with the catalytic domain of lecithin coholesterol acyltransferase and is underlined. Predicted functions for this domain include palmitoyl-protein hydrolase, phospholipase, lipase, sterol esterase, and carboxylesterase activities. No predicted activites can be assigned to the first (residues 1 – 132) and third (residues 235 – 412) domains. The signal peptide is highlighted in yellow. The lipase motif and additional catalytic amino acids are highlighted in green. The glycosylation sites are highlighted in turquoise. Below the amino acid sequent is the PSIPRED predicted structure [105]. Helices are denoted by a magenta line and coil regions are denoted by arrows. C. Minimum-evolution tree of LPLA2 and LCAT proteins. The numbers in parentheses represent NCBI protein GIs for corresponding LPLA2 or LCAT proteins. The protein sequences were first aligned using the Clustal program within the MEGA 4.0 package [106]. Evolutionary distances were computed by using the Tamura-Nei method [107]. Bootstrap analysis using 1,000 repetitions provided support for individual nodes [108]. The numbers next to the branches are the percentages of replicate trees in which the associated taxa clustered together in the bootstrap test (1,000 replicates). The tree is drawn to scale; branch lengths are in the same units as those of the evolutionary distances used to infer the phylogenetic tree. Scale bar indicates nucleotide substitutions per site.


