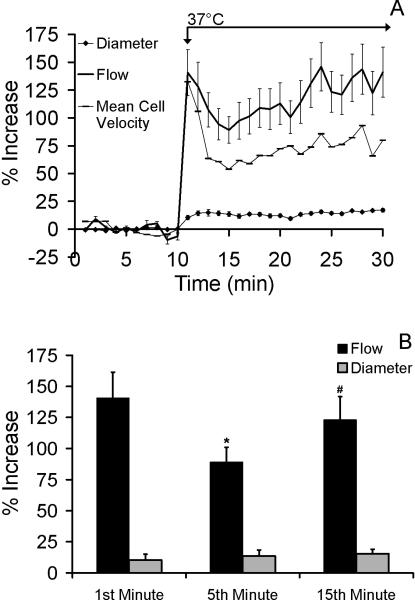
Figure 4.
A) Mean network flow (solid line) and average network mean red cell velocity (connected dashes) (± SEM) increase across the microvascular network (n=10 per vessel group) in a biphasic manner with the application of local heat. Data are presented as mean percent increases from baseline (± SEM). Network flow, velocity, and diameter were significantly elevated with local heat. B) Mean percent increases in flow (black) and diameter (grey) (± SEM) for the entire network (n=10 per vessel group). Increases in flow were significantly elevated (p=0.03) compared to baseline, yet significantly reduced during the 5th minute (p=0.05) compared to the 1st minute (*), and preceding the 15th minute (#).

