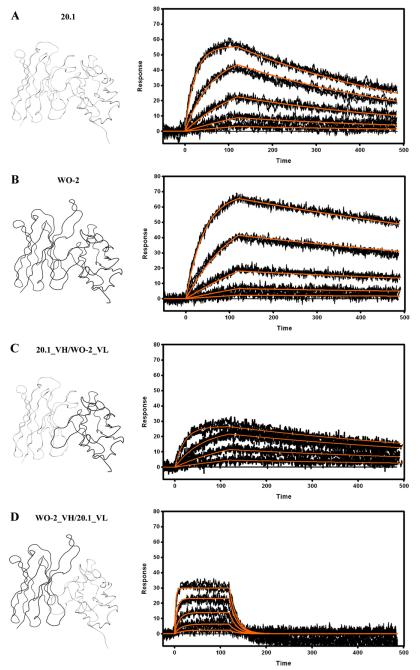
Fig. 4.
Surface plasmon resonance measurements of immobilized 20.1 (A) and WO2 (B) Fab, 20.1_VH/WO2_VL (C) and WO2_VH/20.1_VL (D). The rFab were captured via immobilized Human Fab Binder and Aβ1–16-Im7 was injected at concentration of 27–0.333 nM (A), 81–1 nM (B) or 243–3 nM (C and D). Binding responses (black lines) were fit globally to a simple 1:1 interaction model (red lines). Ribbon representations of the Fv, that are part of the Fab and rFab, are shown on the left hand side. Data are representative of three experiments.

