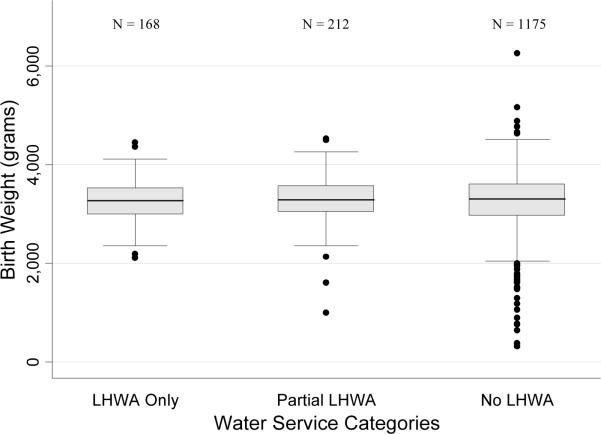
FIGURE 1. Birth Weight Distributions Among Water Service Categories (January 2003 – August 2005).
Boxplots in Figure 1 depict median birth weight and interquartile range (IQR) for each LHWA water service category. Whiskers extend to the highest data point located ≤ 1.5 IQR. Outliers greater than 1.5 times the IQR are indicated with a black dot.

