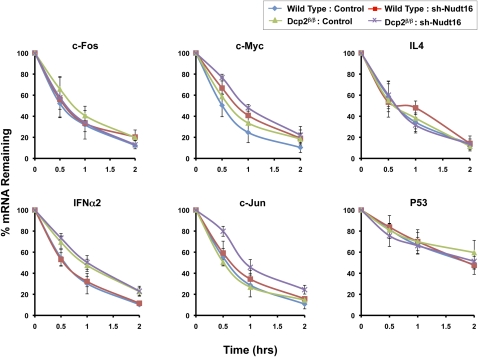
FIGURE 5.
Differential utilization of Dcp2 and Nudt16 in ARE-mediated decay. mRNA levels of the indicated mRNAs were followed up to 2 h post-actinomycin D treatment. Levels of the denoted endogenous ARE-containing mRNAs remaining at the indicated time points were determined by quantitative reverse transcription and real-time PCR. The values of three independent RNA preparations normalized to the β-actin mRNA are shown, with ± standard deviation. Cell-line nomenclature is as described in the legend to Figure 1.

