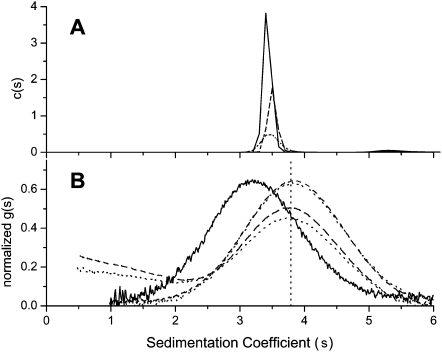
FIGURE 2.
(A) Sedimentation coefficient distribution c(s) determined by program Sedfit for three different Hfq6 concentrations, 3.2, 5.7, and 12 μM shown as dotted, dashed, and solid lines, respectively. The average integrated value for these data is 3.51 ± 0.03 S. (B) Sedimentation coefficient distribution displayed as normalized g(s) for Hfq6 at 6.9 μM alone as solid line (average integrated value for Hfq data is 3.42 ± 0.04 S), and with 4.4 μM and 8.3 μM FAM-A18 added. Upper pair of overlapping dashed and dotted lines show the 6.9:4.4 mixture evaluated by absorbance at 274 nm and 495 nm, respectively. Lower pair of dashed and dotted lines display the 6.9:8.3 mixture evaluated at the same two wavelengths. Lack of alignment of c(s) and g(s) peaks for Hfq6 alone (3.51 S vs. 3.42 S) is attributed to minor components affecting the main c(s) peak.

