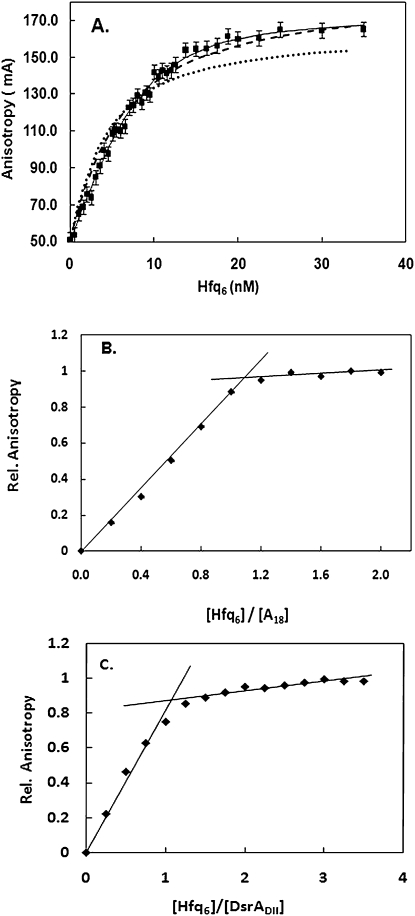
FIGURE 4.
Fluorescence anisotropy titration of FAM-A18 with Hfq. (A) Comparison of experimental data with 2 nM FAM-A18 (squares) to best fit of 2:1 model (solid line), 1:1 model with Kd variable (circles), and 1:1 model with variable Kd and Ab (dotted line). Parameters for: 2:1 model; K1 = 10.1 nM, K2 = 5 nM, Ab1 = 0.148, Ab2 = 0.172. For 1:1 models; K1 = 4.4 nM, Ab = 0.166 for dotted line, K1 = 5 nM, Ab = 0.185 for dashed line. (B) Experimental anisotropy measurements of 5 μM FAM-A18 titrated with Hfq6. (C) Experimental anisotropy measurements of 2 μM DsrADII titrated with Hfq6.

