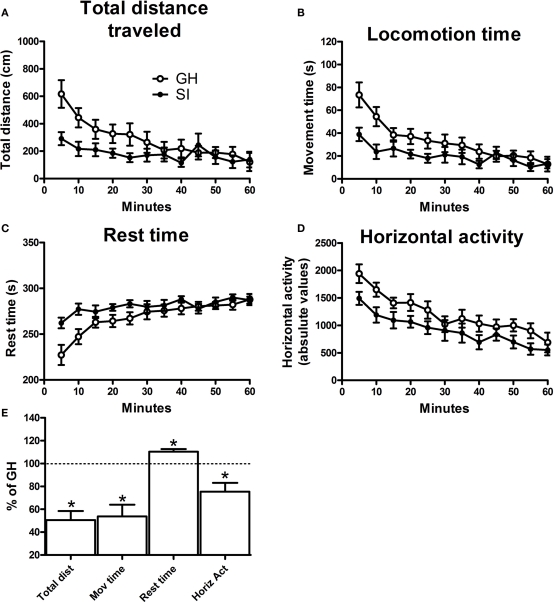
Figure 1.
Spontaneous locomotor activity in isolated (SI) and group-housed (GH) C57BL/6J mice. Locomotor activity was assessed in a motility meter after the 6-week isolation period. The different parameters of motor activity (A) total distance traveled, (B) locomotion time, (C) rest time, and (D) horizontal activity, were averaged in bins of 5 min, for 60 continuous min. Data in graphs (A) through (D) are mean ± SEM (n = 9 per group) of the absolute values of the different measures. Graph (E) summarizes the effects of SI on locomotor activity as measured during the initial 15 min. Data are expressed as mean ± SEM of the percentage vs. GH mice. *p < 0.05 vs. GH animals.

