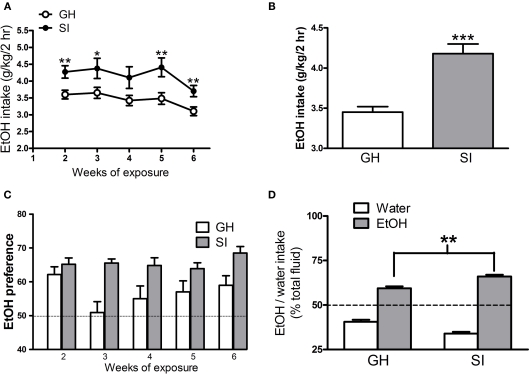
Figure 2.
Effects of SI on voluntary EtOH consumption and preference. (A) The graph shows the daily average EtOH intake in GH and SI C57BL/6J mice during the 5-weeks of exposure to the 15% solution of EtOH. (B) The bar graph shows the average EtOH intake for the whole 5-week period of exposure to 15% EtOH solution in both groups of mice. (C) EtOH preference in GH and SI mice; the graph shows the percent of EtOH self-administered week by week with respect to the total fluid consumed. (D) The graph shows the percent of water or EtOH self-administered with respect to the total fluid consumed during the whole 5-week period (n = 22 for SI and n = 21 for GH mice). *p < 0.05; **p < 0.01; ***p < 0.001 vs. GH mice.

