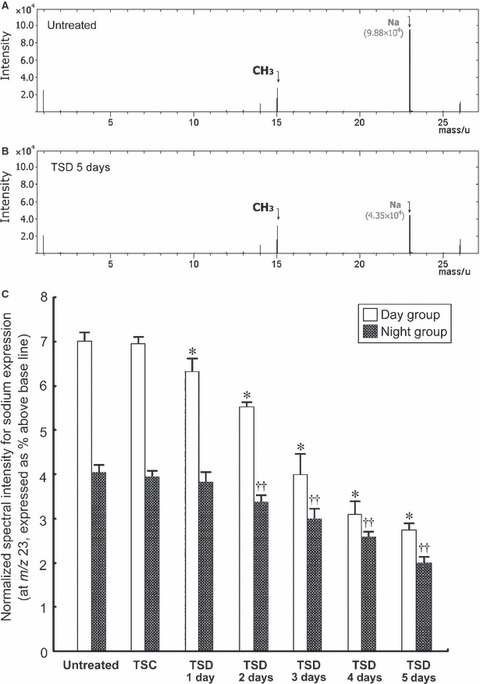
Fig. 1.

Time-of-flight secondary ion mass spectrometry positive ion spectrum (A,B) and histogram (C) showing quantitative intensity (total ion counts per 500 μm2) and normalized spectral intensity of Na+ (expressed as percentage above the baseline) in the suprachiasmatic nucleus of normal untreated, control for total sleep-deprived (TSC) and total sleep-deprived (TSD) rats. In normal untreated rats (A), the quantitative intensity of Na+ was 9.88 × 10⁴ (total ion counts per 500 μm2). However, following 5 days of TSD (B), the Na+ intensity was much lower (4.35 × 10⁴; total ion counts per 500 μm2). Similar findings were observed in the normalized spectral intensity (C), in which data obtained from untreated rats (7.011 ± 0.18% for the day group and 4.003 ± 0.16% for the night group) were significantly higher than from TSD rats (2.734 ± 0.15% for the day group and 2.112 ± 0.22% for the night group following 5 days of TSD). It is noteworthy that, no matter at which time-point the sample was performed (day or night group), the normalized spectral intensity showed a decrease in the expression after TSD treatment. *P<0.05 compared with the day group of normal untreated rats; ††P<0.05 compared with the night group of normal untreated rats.
