
Fig. 7.
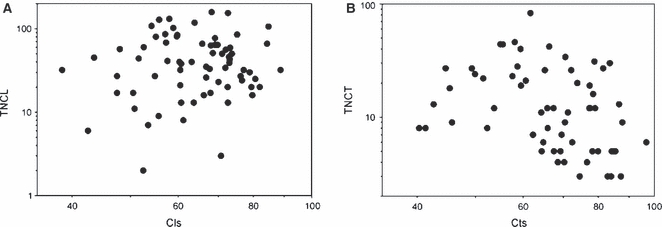
Graphs illustrating the correlations between (A) global compactness (Cls) and the total number of cavities in longitudinal sections (TNCL), and (B) global compactness (Cts) and the total number of cavities in transverse sections (TNCT).
Official websites use .gov
A
.gov website belongs to an official
government organization in the United States.
Secure .gov websites use HTTPS
A lock (
) or https:// means you've safely
connected to the .gov website. Share sensitive
information only on official, secure websites.
Graphs illustrating the correlations between (A) global compactness (Cls) and the total number of cavities in longitudinal sections (TNCL), and (B) global compactness (Cts) and the total number of cavities in transverse sections (TNCT).