
Fig. 8.
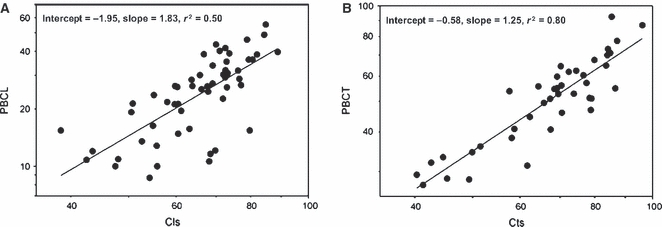
Graphs illustrating the correlations between (A) global compactness (Cls) and the relative area of primary periosteal bone in longitudinal sections (PBCL), and (B) global compactness (Cts) and the relative area of primary periosteal bone in transverse sections (PBCT).