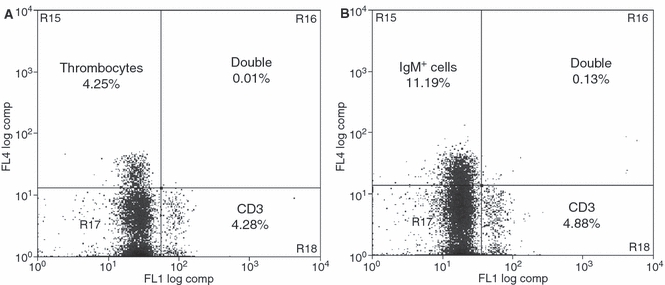
Fig. 7.

Double-flow cytometry analysis with rainbow trout splenocytes using the anti-CD3ε antisera and population specific antibodies for thrombocytes and IgM+ lymphocytes. (A) Double-labelling with a thrombocyte specific mAb. The figure shows an Alexa488 (FL1) against TriColor (FL4) dot plot. CD3ε single-positive cells are depicted in the lower right quadrant, thrombocytes in the upper left quadrant, while double-negative cells appear in the lower left quadrant. A negligible number of double-positive cells (0.01%) remain in the upper right quadrant. (B) Double-flow cytometry analysis using the CD3ε antiserum and mAbs specific for rainbow trout IgM. The figure shows an Alexa488 (FL1) against TriColor (FL4) dot plot. CD3ε single-positive cells are depicted in the lower right quadrant, IgM+ cells in the upper left quadrant, while double-negative cells appear in the lower left quadrant. A negligible number of double-positive cells (0.13%) were found in the upper right quadrant. The images depict a typical experiment repeated with four different individuals.
