Fig. 1.

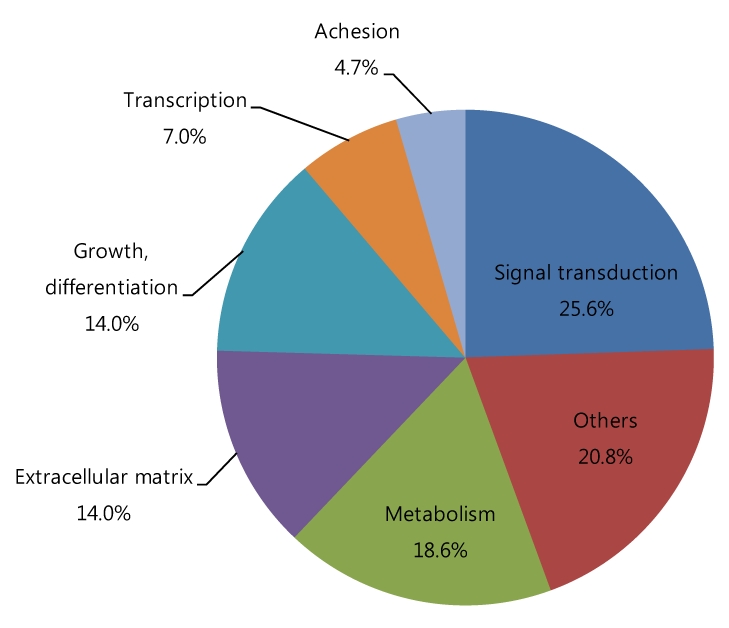
Diagram of the proportions of genes up- and down-regulated by 1.5-fold in oxygen-induced retinopathy rats versus controls according to function.

Diagram of the proportions of genes up- and down-regulated by 1.5-fold in oxygen-induced retinopathy rats versus controls according to function.