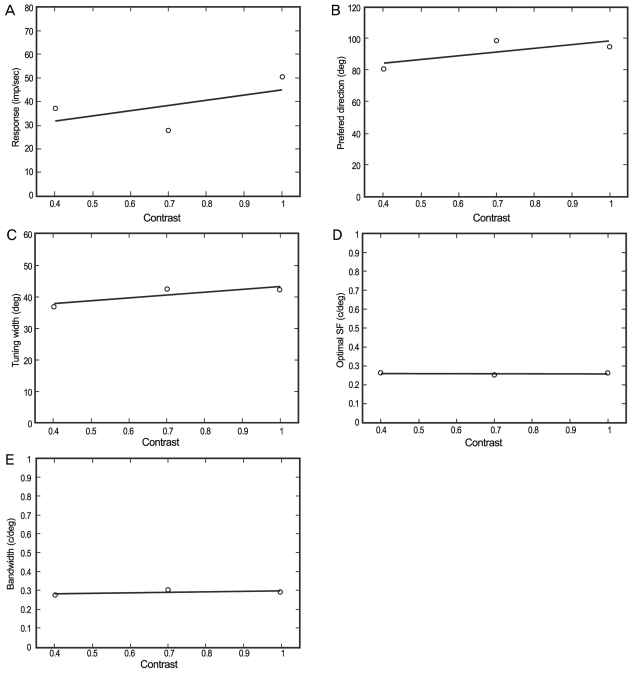
Fig. 2.
Changes in five different parameters (A-E) at three contrast levels (0.4, 0.7, and 1.0). (A) Responses for the gratings. The slope of linear regression was fitted to the optimal responses as functions of the various contrasts. (B) Optimal directions. (C) Tuning widths. (D) Optimal spatial frequencies (SF). (E) Band widths.

