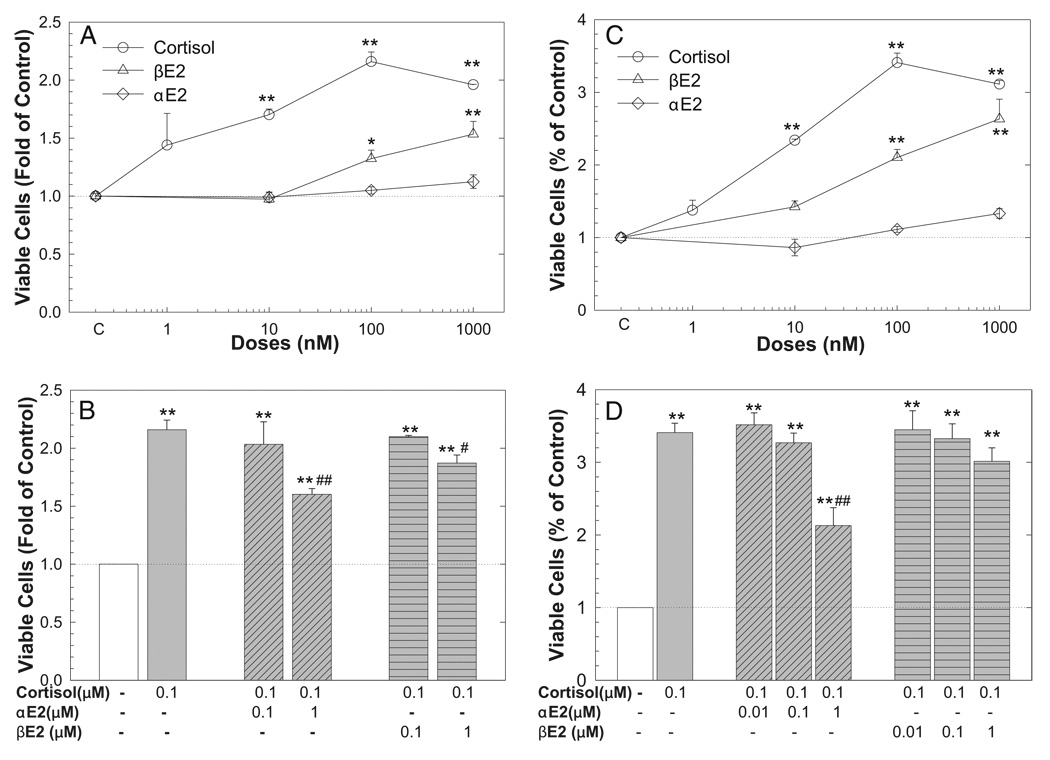
Figure 7.
Cortisol induced MDA Pca-2b cell growth was inhibited by αE2 co-administration. Cells were seeded in 96-well plates and treated with vehicle control, or various cortisol, αE2 or βE2 doses alone (A and C) or in combination (B and D) for 3 (A and B) and 6 (C and D) days. At experiment end number of viable cells was determined by cell proliferation assay and expressed as fold of vehicle control. Data represent mean ± SEM of 6 to 12 individual samples in 2 to 4 independent experiments done in triplicate. Single asterisk indicates p <0.05 vs vehicle control. Double asterisks indicate p <0.01 vs vehicle control. Single pound sign indicates p <0.05 vs 100 nM cortisol alone. Double pound signs indicate p <0.01 vs 100 nM cortisol alone.

