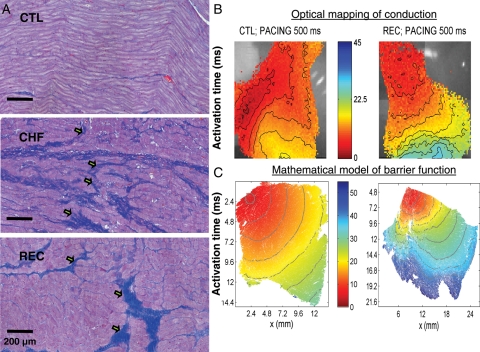
Figure 4.
(A) Longitudinal sections of Masson trichrome-stained atrial tissue from a control dog (top), a dog in which 2-week tachypacing at 240b.p.m. led to CHF (middle) and a dog tachypaced into CHF and then allowed to recover for 4 weeks without tachypacing (REC), which permitted full haemodynamic recovery (bottom). Collagen is stained blue, cardiomyocytes are pink. Arrows point to regions in which transverse fibrosis interrupts cardiomyocytes in their longitudinal direction. (B) Optical maps of electrical conduction in right atrial tissue preparations from a control (left) and a REC dog (right). Tissues were paced at 2 Hz at the upper left corner. The activation colour scale is in ms. (C) Results of mathematical modelling of conduction in simulated tissues with the same fibrosis distribution as the preparations shown immediately above, assuming that fibrosis acts as a non-conductive barrier. The mathematical model accounted well for the electrical propagation changes observed experimentally. Reproduced from the reference88 with permission of the American Heart Association.

