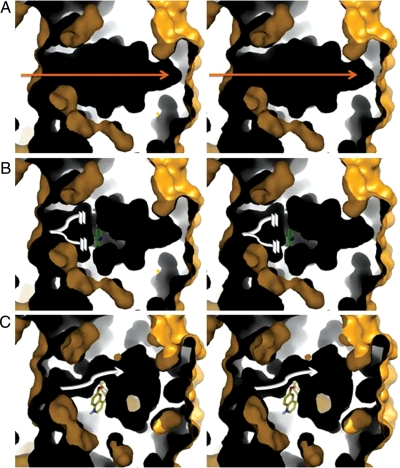
Figure 2.
Stereoviews of solvent accessible surface maps of the intracellular pore of Kir2.1 in complex with chloroquine and quinidine. Views oriented with respect to a 90° rotation of Figure 1A and B. Kir2.1 cytosolic side is on the left in each figure. Outer surfaces: yellow; cavities: black. Slabbed surfaces reveal the cavity of the inner vestibule of the intracellular domain of Kir2.1. (A) Surface map for Kir2.1. Surface map of Kir2.1 in complex with chloroquine (B) and quinidine (C). Orange arrow: ion-permeation pathway in Kir2.1 alone. Broken white lines: break in the ion-permeation pathway. White arrow: narrowing of the ion-permeation pathway.

