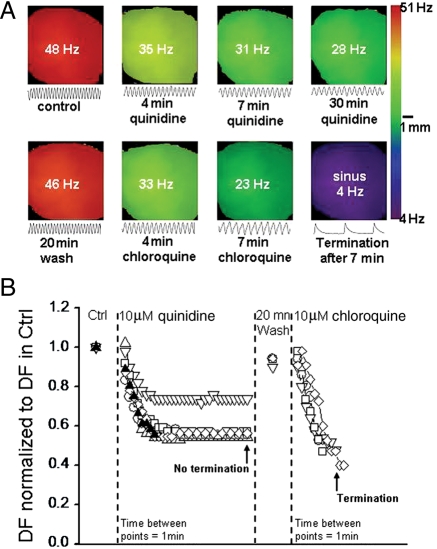
Figure 4.
Effects of chloroquine and quinidine on ventricular arrhythmia. (A) Top row: DF maps at the onset of pacing-induced VT (DFmax = 48 Hz), 4 min (35 Hz), 7 min (31 Hz), and 30 min (28 Hz) after starting 10 μM quinidine. VT slowed down but did not terminate. Bottom row: DF maps of VT after 20 min quinidine washout (DFmax = 46 Hz), then at 4 min (33 Hz) and 7 min (23 Hz), followed by sinus rhythm restoration (4 Hz), in the presence of 10 μM chloroquine. Single pixel recordings (500 ms) are shown below each map. (B). Plot of normalized DFmax in six hearts during VT. In five of six hearts (open symbols) 30 min of 10 μM quinidine slowed down but did not terminate VT/VF. In one heart tachyarrhythmia terminated (filled symbol). After 20 min of washout, 10 μM chloroquine applied to five tachyarrhythmic hearts terminated the arrhythmias and sinus rhythm resumed.

