
Figure 1. Correlated firing among ON and OFF parasol cells.
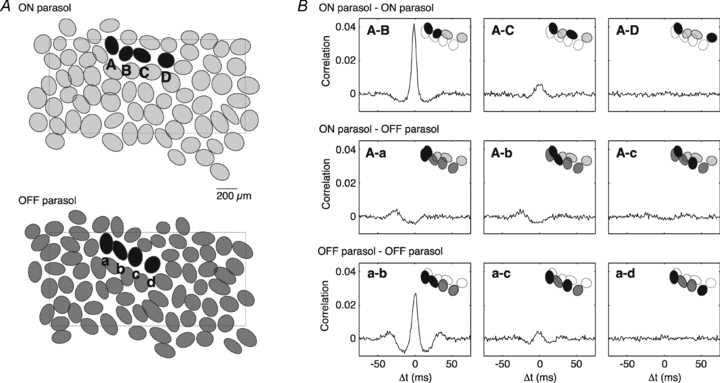
A, receptive field outlines of complete ON and OFF parasol cell mosaics, simultaneously recorded. Outlines are drawn at the 1 s.d. contour of Gaussian fits (see Methods). Rectangle indicates the outline of the electrode array. B, cross-correlation of the spontaneous activity between cells labelled in A; cell pairs are given in insets. Note the positive correlation in the ON–ON and OFF–OFF pairs, the negative correlation in ON–OFF pairs, and the decline in correlation with distance. Bin size: 1 ms.