
Figure 3. Subsarcolemmal (SS) and intermyofibrillar (IMF) mitochondrial area (A and C) and density (B and D) in heart muscle from lean and obese Zucker rats.
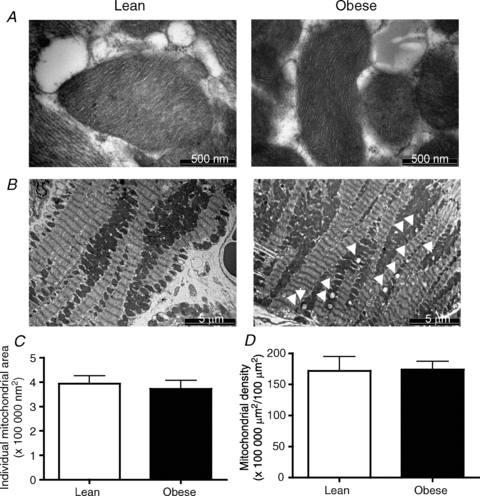
Data are expressed as the mean ± s.e.m. Images were taken either at 64,000× (A) or 5,800× (B) magnification, and the black scale bar is 500 nm (A) or 5 μm (B), respectively. n = 6 animals for each experiment. White arrowheads indicate lipid droplets.