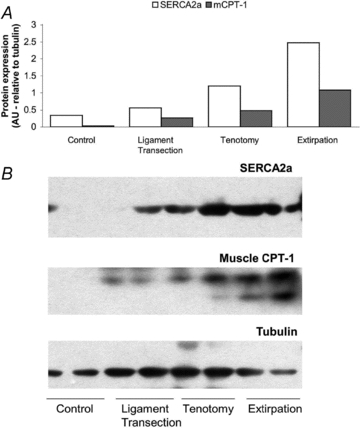
Figure 2. Relative protein concentration of SERCA2a and m-CPT-1 in EDL subjected to three degrees of overload.

A, relative protein content in pooled muscle samples, normalised to tubulin content, run in duplicate for SERCA2a (open bars) and m-CPT1 (shaded bars) 7 days after intervention. Note the graded increase in both indices of muscle activation with degree of overload. B, representative Western blots; densitometry was performed on the upper band of m-CPT-1, and the lower band is likely to represent another CPT isoform.
