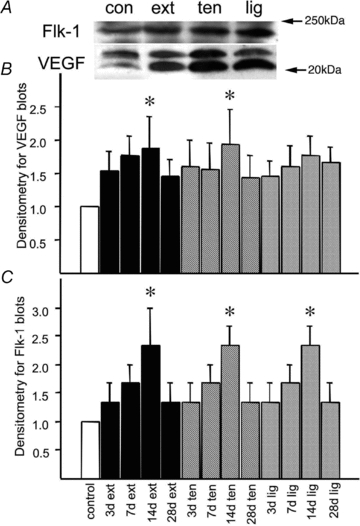
Figure 4. VEGF and Flk-1 expression in three models of muscle overload.

A, Flk-1 and VEGF expression levels are shown for control (Con), 7 days after extirpation (Ext), 7 days after tenotomy (Ten) and 7 days after ligament transection (Lig). Denistometric analysis of both bands provided an estimate of total VEGF content. B, densitometry data for VEGF blots are shown for control rats (1st column), extirpated (columns 2–5), tenotomised (columns 6–9) and ligament transection (columns 10–13) for 3, 7, 14 and 28 days. Data are means ± s.e.m., normalised to control. *P < 0.05 vs. control (n = 3 per group). C, densitometry data for Flk-1 blots are shown for control rats (1st column), extirpated (columns 2–5), tenotomised (columns 6–9) and ligament transection (columns 10–13) for 3, 7, 14 and 28 days. Data are means ± s.e.m., normalised to control. *P < 0.05 vs. control (n = 3 per group). N.B., error bars were generated from replicates of pooled samples to determine the variability among treatments.
