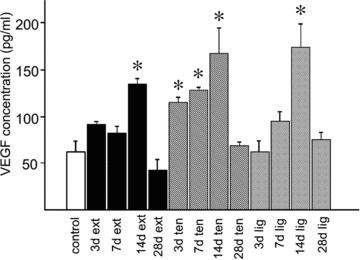
Figure 5. Time course of VEGF expression in different models of overload.

VEGF concentration is given as pg per ml of total protein extracted by detergents (see Methods), using samples pooled from 3 animals measured on the ELISA at three different dilutions. Data are shown for control rats (1st column), extirpated (columns 2–5), tenotomised (columns 6–9) and ligament transection (columns 10–13) for 3, 7, 14 and 28 days.
