
Figure 1. Course of systolic blood pressure (A) and body weight (B) in I3C-induced Cyp1a1-Ren-2 rats, and effects of sEH inhibition by c-AUCB (13 and 26 mg l−1) in these rats (n = 8 in each group).
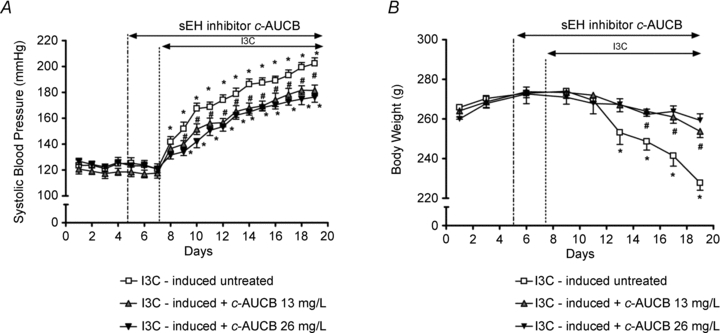
Data represent mean values ± s.e.m. *P < 0.05 vs. basal values; #P < 0.05 vs. I3C-induced untreated rats.