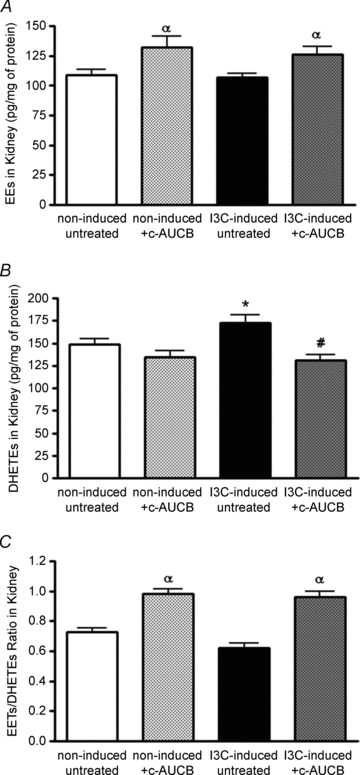
Figure 5. Epoxyeicosatrienoic acids (EETs) (A) and dihydroxyeicosatrienoic acids (DHETEs) (B) in kidney cortex at the end of the experimental period in groups of Cyp1a1-Ren-2 rats exposed to I3C administration and c-AUCB treatment (n = 6–8) and EETs/DHETEs ratio (C), as an indicator of c-AUCB treatment efficiency.

Data represent mean values ± s.e.m. αP < 0.05 vs. untreated groups; *P < 0.05 vs. non-induced groups; #P < 0.05 vs. I3C-induced untreated rats.
