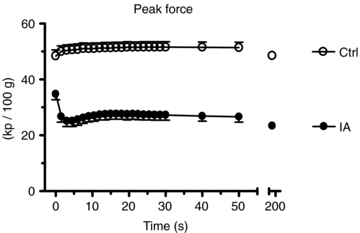
Figure 1. Mean (± s.d.) values of peak force in the two experimental conditions (control, Ctrl and iodoacetamide infusion, IA).

The x axis is broken in order to allow the reader to better notice the time-course of the variable during the first 50 s of contractions. During the first 30 s peak force values obtained during each contraction are shown, whereas after 30 s of contractions mean values calculated every 10 s are presented. Throughout the contraction period peak force was lower in IA vs. Ctrl. There was substantially no fatigue in Ctrl, whereas in IA peak force declined by about 30% during the 2nd–4th contractions vs. the first, slightly recovered at 15–20 s and then slightly decreased during the ensuing contraction period. See text for further details.
