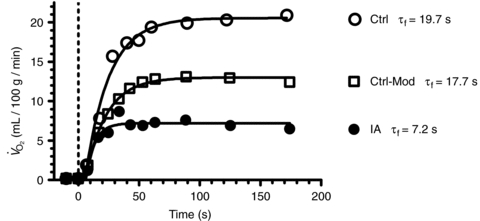
Figure 4. Individual kinetics from a typical experiment.

Time = 0 and the vertical hatched line indicates contractions onset.  data were fitted by a mono-exponential function, which is also shown in the figure. A second control condition (Ctrl-Mod) was introduced, which accounted for the effects on
  kinetics deriving from the non-square wave error signal in IA. Calculated time constants (τf) are also presented. See text for further details.
